Check the results
Once an analysis is completed, you can enter Firmware analysis view and check the results. To do so, click on a firmware name in the Latest uploads section of your dashboard.
Here you can check:
- Found CVEs
- Found security issues
- The extracted components
- The extracted files
- Compliance information
- The extracted blobs
- Found artifacts
Note
The results displayed in Firmware analysis view are only for the selected firmware. If you want to see the analysis results for all your uploaded firmware, see Global results.
On some pages, you can customize the data displayed in the tables. Use the menu to add/remove data columns.
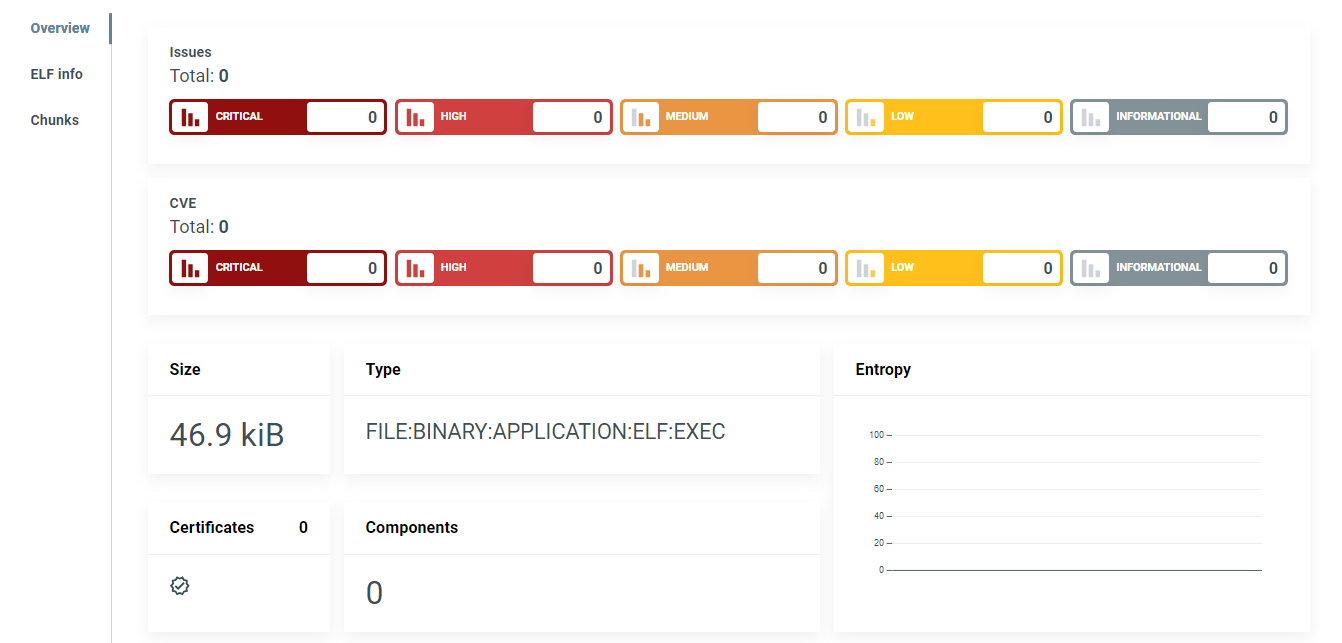
Analysis overview
The default landing page is Analysis Overview, which displays the analysis results and ranks the security risks from INFORMATIONAL to CRITICAL.
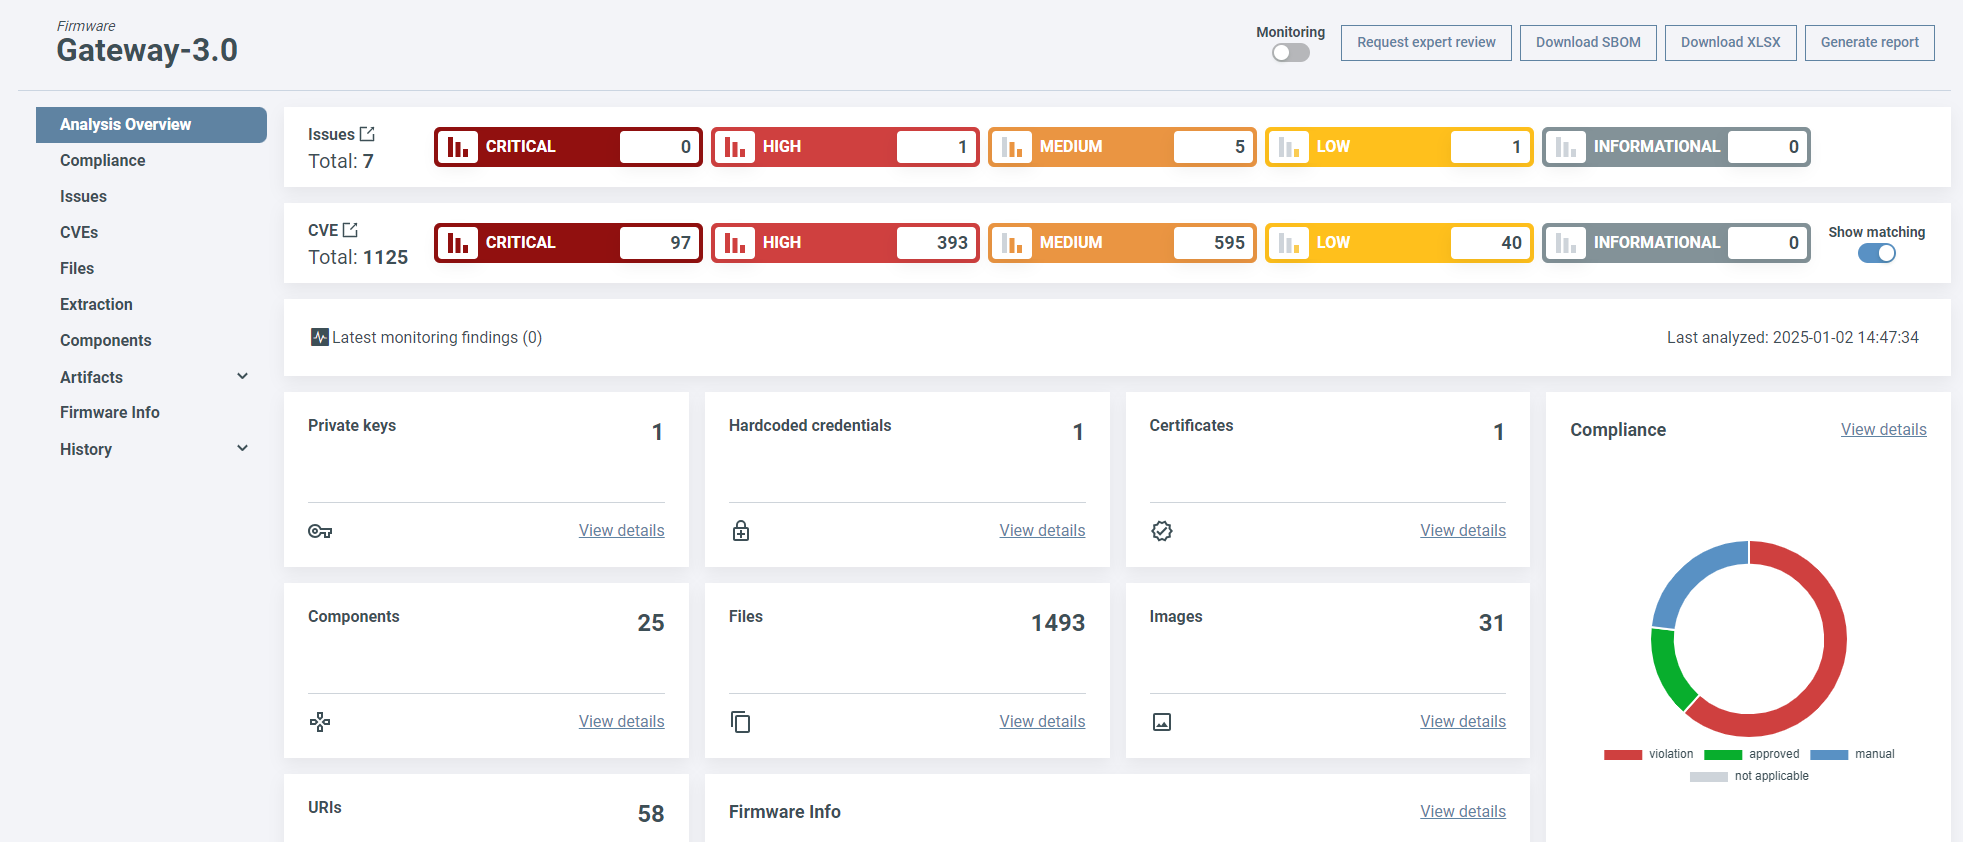
Select a severity category to view all issues/CVEs in it. To see all security issues and CVEs grouped by vulnerability status (both open and closed) and by severity, click on the Graph icon near the total number of vulnerabilities. (1)
- The same graph is available when viewing a specific file or component, showing vulnerabilities specific to that item. You can also view the graph on the CVEs or Issues page, where it’s scoped to the selected vulnerability type.
CVEs
See all vulnerabilities found in your firmware.
Click on a vulnerability for more details:
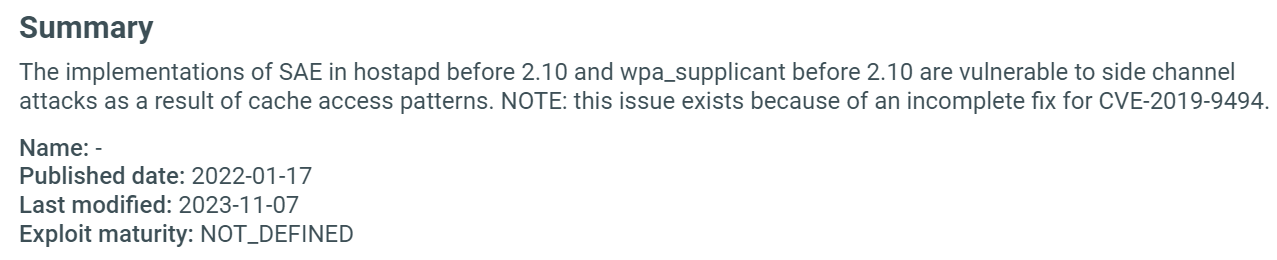
Use the links in the References section to learn more about an exploit.
ONEKEY lists vulnerabilities from multiple data sources: NIST NVD (National Vulnerability Database) and OSV (Open Source Vulnerabilities).
Info
ONEKEY uses Automated Impact Assessment to automatically determine if a vulnerability is relevant or not for specific firmware, so only applicable vulnerabilities are displayed.
To focus your analysis, you can filter out non-relevant vulnerabilities.
Issues
On the Issues page, you can check the found security issues categorized by type and severity. Next to each category, you can see the number of identified security risks.
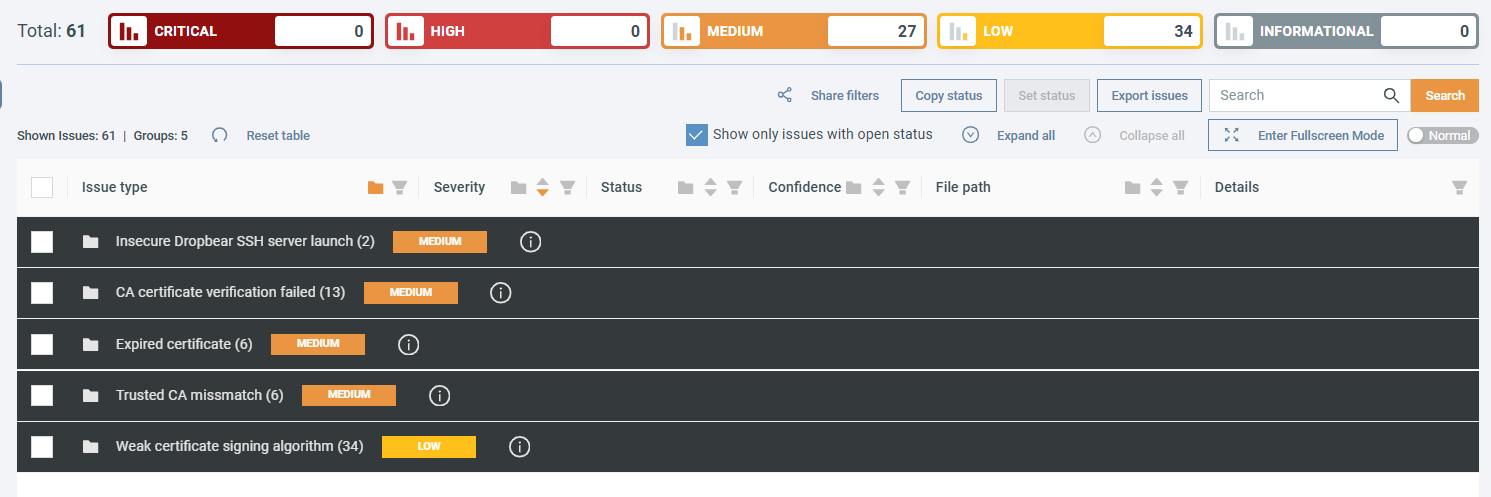
Click on a category to view all issues in it. Each issue has:
- a severity score,
- a confidence score,
- a short description,
- and the corresponding file path.
Click on an issue for more details, such as fingerprints, CVSS score, or the specific line where the issue was found:
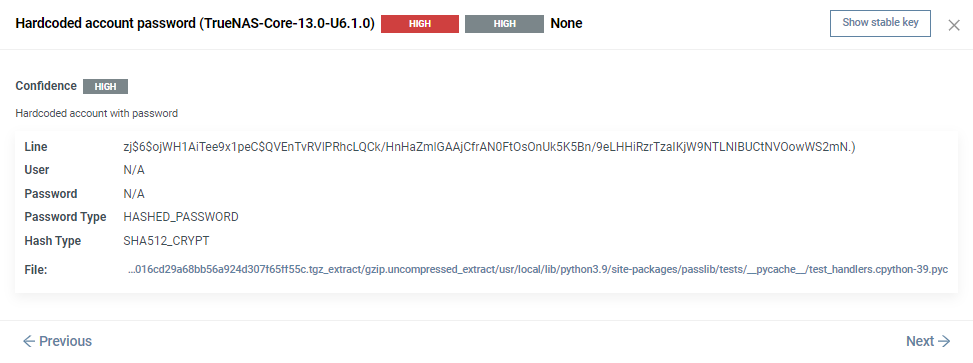
Use the Previous and Next buttons to quickly switch between issues.
To learn more about issue types, see Security issues.
Components
See the software and 3rd party open-source components that make up your firmware.
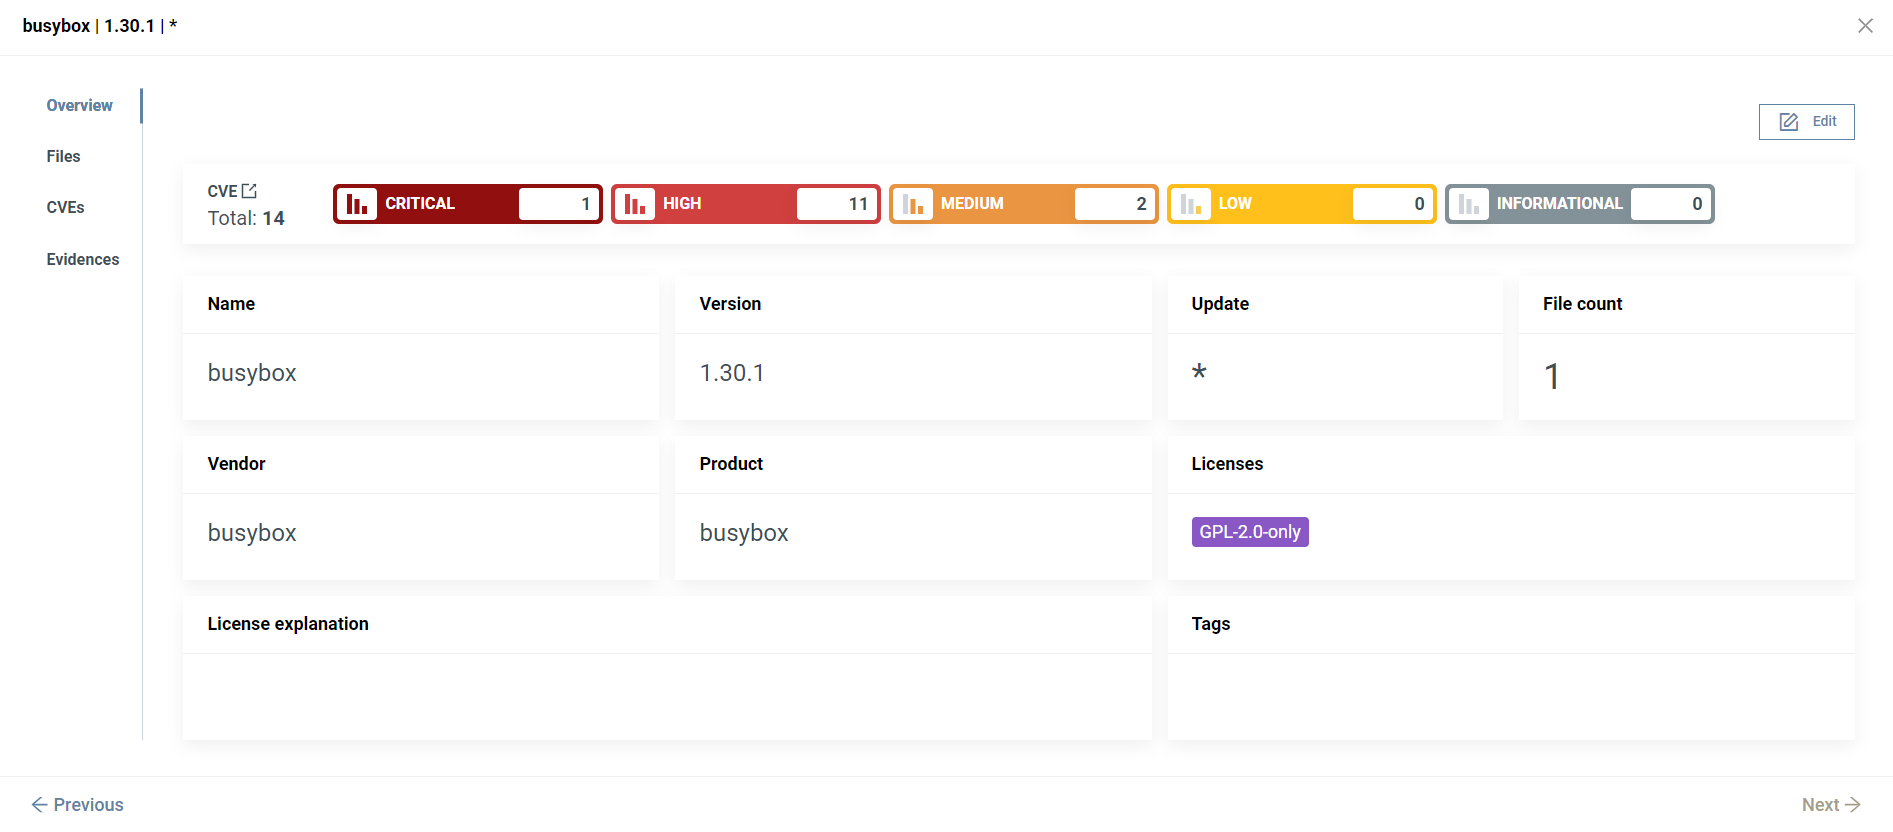
Select a component from the table to open the Component details. Here you can see,
- some basic information about the component (Overview tab),
- the files it contains (Files tab),
- the CVEs found (CVEs tab),
- and a list of items that indicate the methods and sources used in identifying the selected component (Evidences tab).
Regardless of whether an SBOM file is included with your firmware image, ONEKEY will extract the components. The resulting list is a combination of the SBOM contents and the analysis results.
You can jump directly to the files for a specific component by clicking Go to files.
For more information about the Components page, for example component editing, see SBOM management
Component dependencies
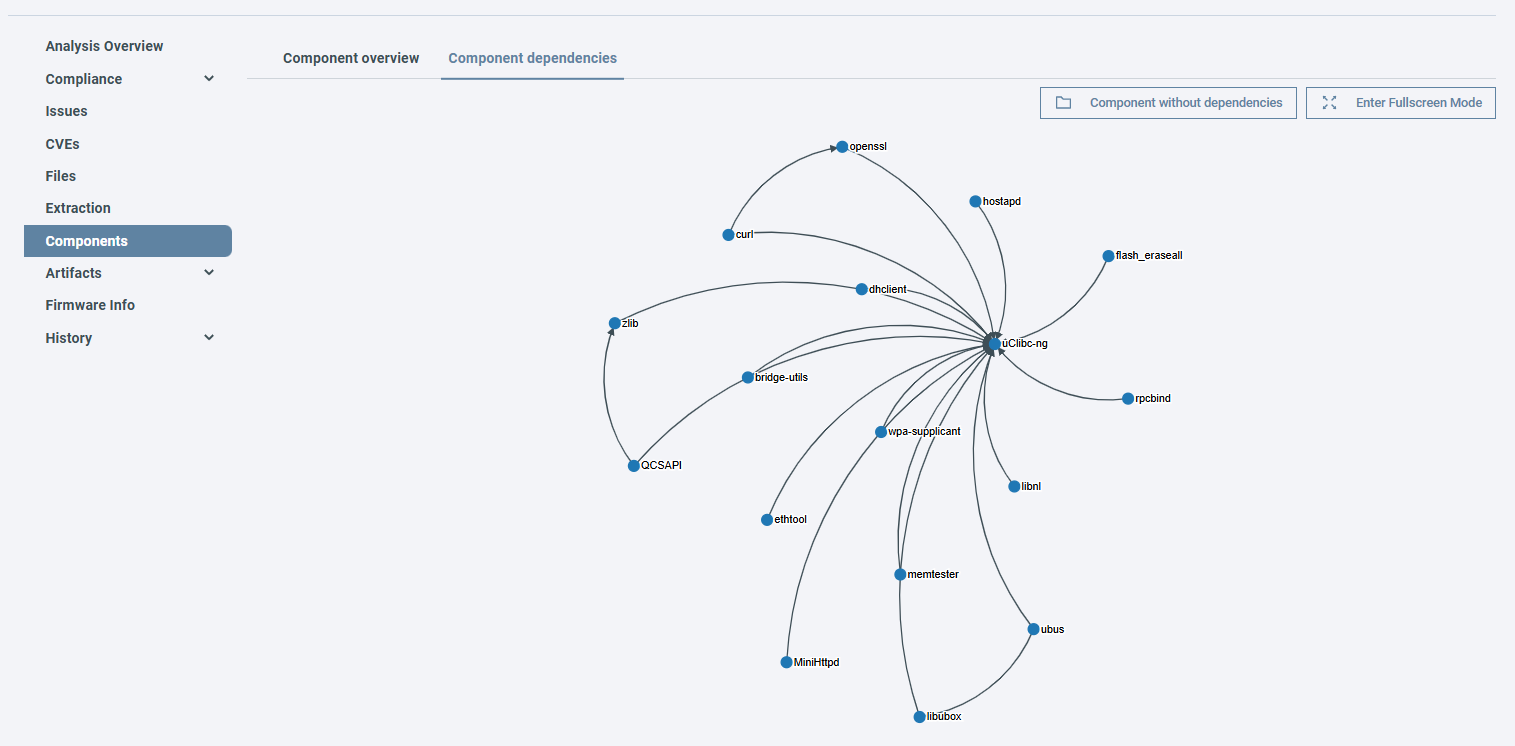
The Component dependency visualizations allow you to see the relationships between the components in your firmware, helping you better understand its structure and identify potential security implications of connected elements.
See all component relationships through the Component dependencies tab in Firmware analysis view → Components. (1)
-
- Hover over a node to highlight its dependencies.
- Click on a node to open the Component details.
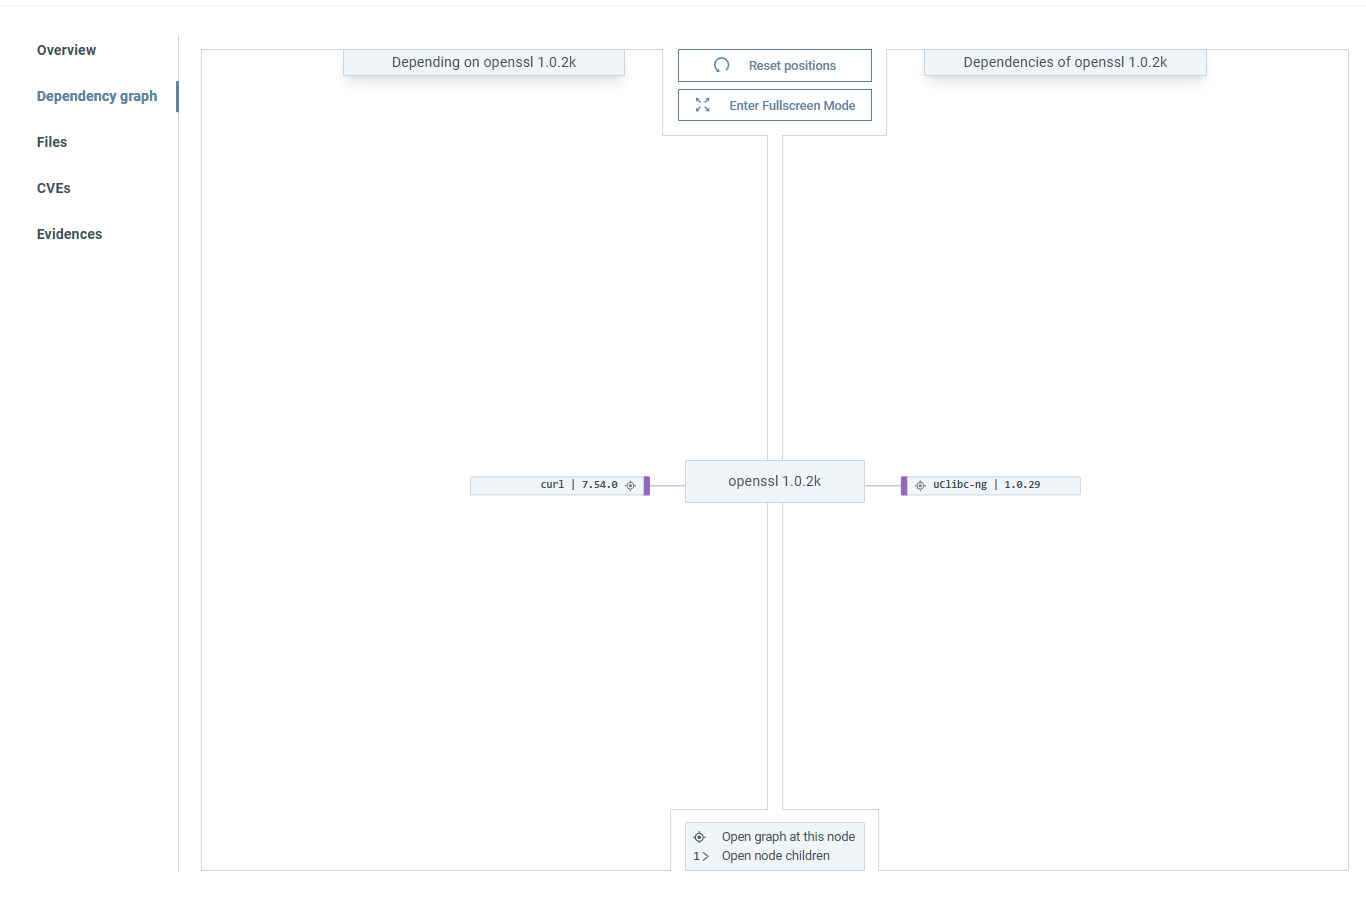
For dependencies of an individual component, select any component and click Dependency graph on the popup. (1)
-
- Drag and drop a dependency the move the graph around.
- Click to open the graph for the selected node.
- Click the numbered button to view the node's dependencies or dependent components.
Note
If a component has no connections on either the 'Depending on...' or 'Dependencies of...' side, that side is hidden by default.
Files
On the Files page, you can browse the file system of the selected firmware. Click on a folder to expand it. Click on a file to display its properties and content:
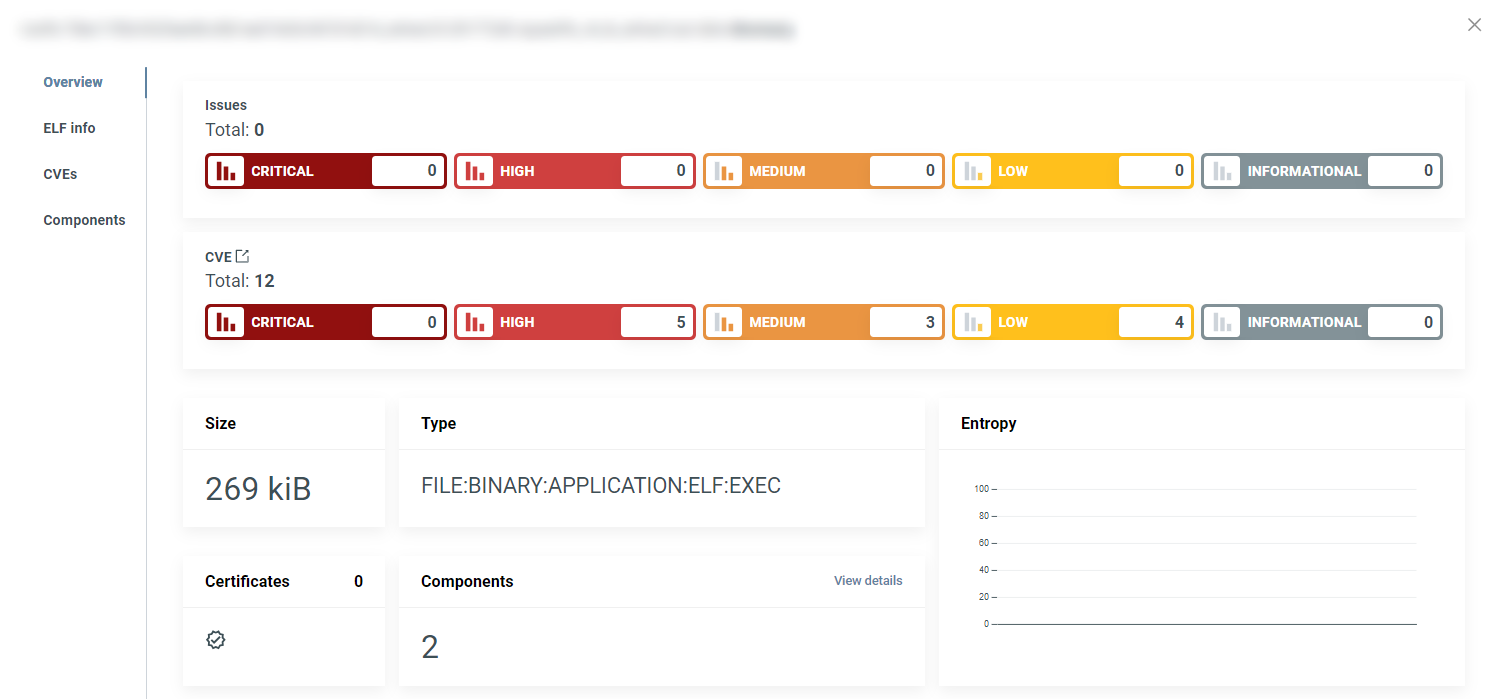
In the left sidebar of the popup, you can see menus for context-specific information that only applies to the selected file. Click on a menu item to see more details. For ELF files, for example, you will see the ELF info menu. Click here to see details such as Compile Time Mitigation or Symbols:
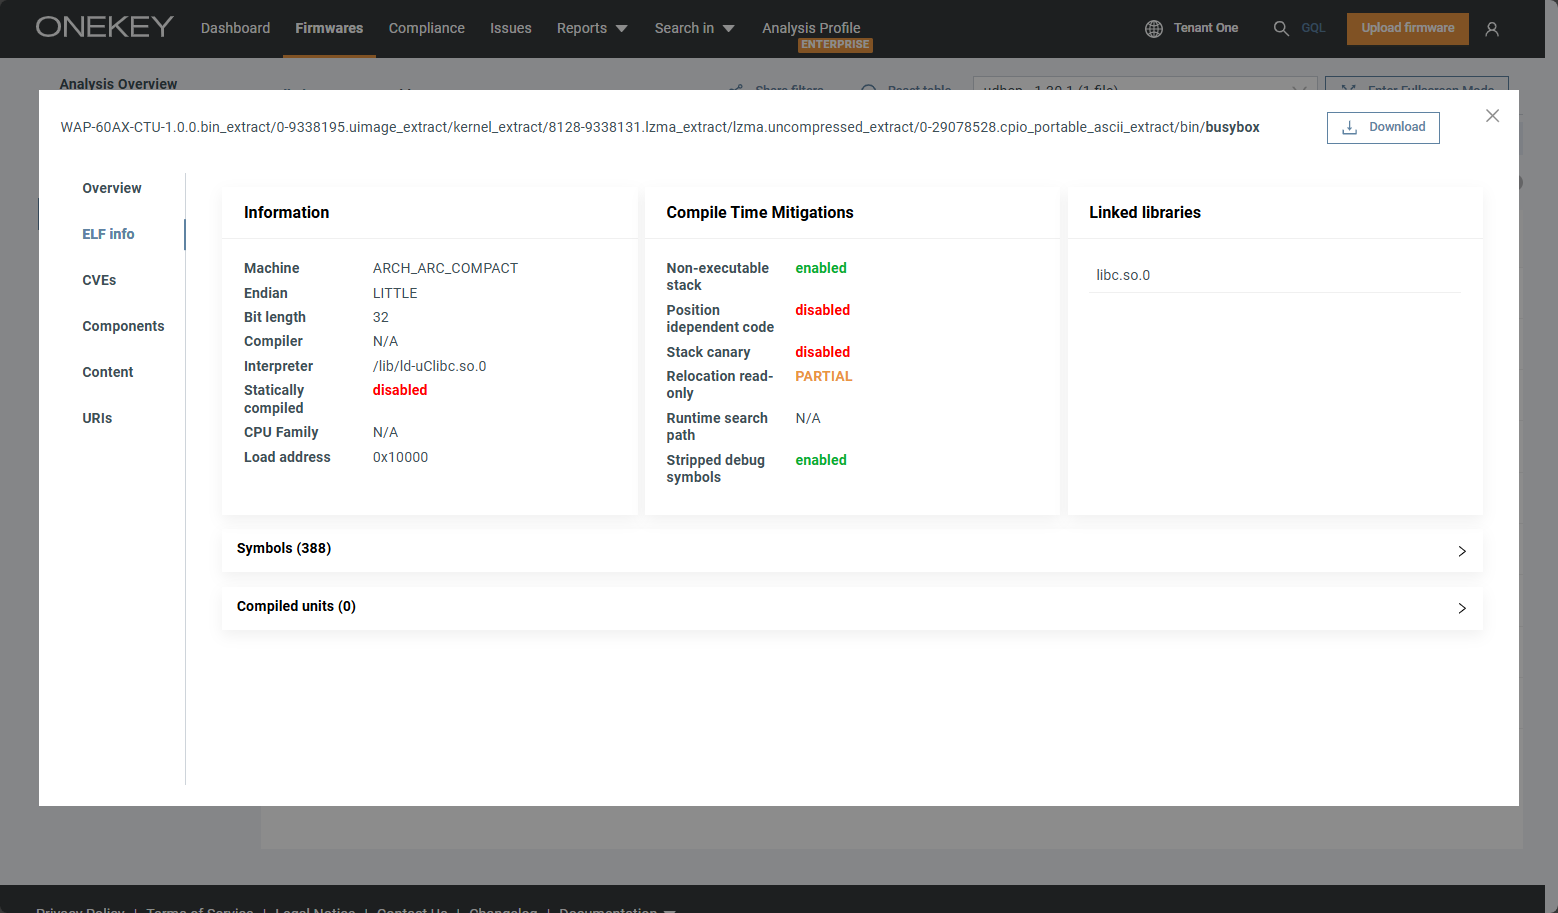
If a file contains artifacts such as certificates or passwords, click on Artifacts to find out more. If we have found issues or CVEs in the file, these too will be listed in the corresponding menu items.
You can view a visualization of the directory structure by selecting the Folder structure tab.
Tip
In File details, you can download a file by clicking Download file at the bottom of the Overview page. Alternatively you can click on in table view.
Note that folders cannot be downloaded.
Folder structure visualization
This function provides an overview of the folder structure with the ability to zoom in on the interesting parts and highlight detected software components. (1)
-
- Click on a folder (a turquoise rectangle in the visualization) to see its content.
- Click on a file (a dark blue rectangle) to open the File details.
- To go back to a previous folder click the folder's name at the top.
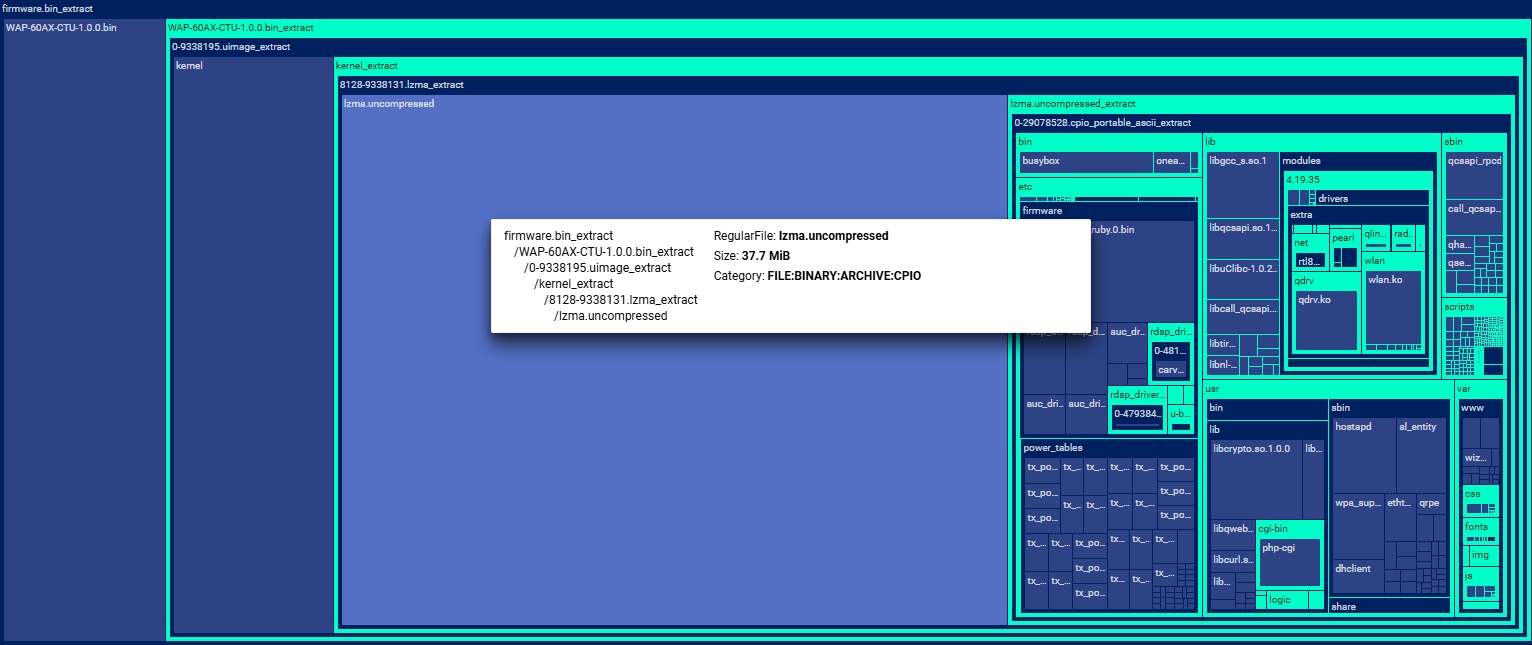
Colors and their meaning
Dark blue: files
Turquoise: folders
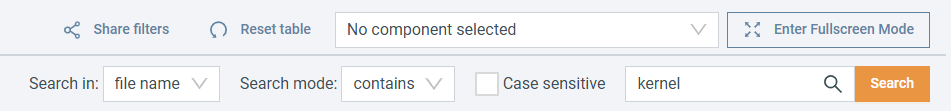
You can filter the results based on components and files using the dropdown or the search bar under it:
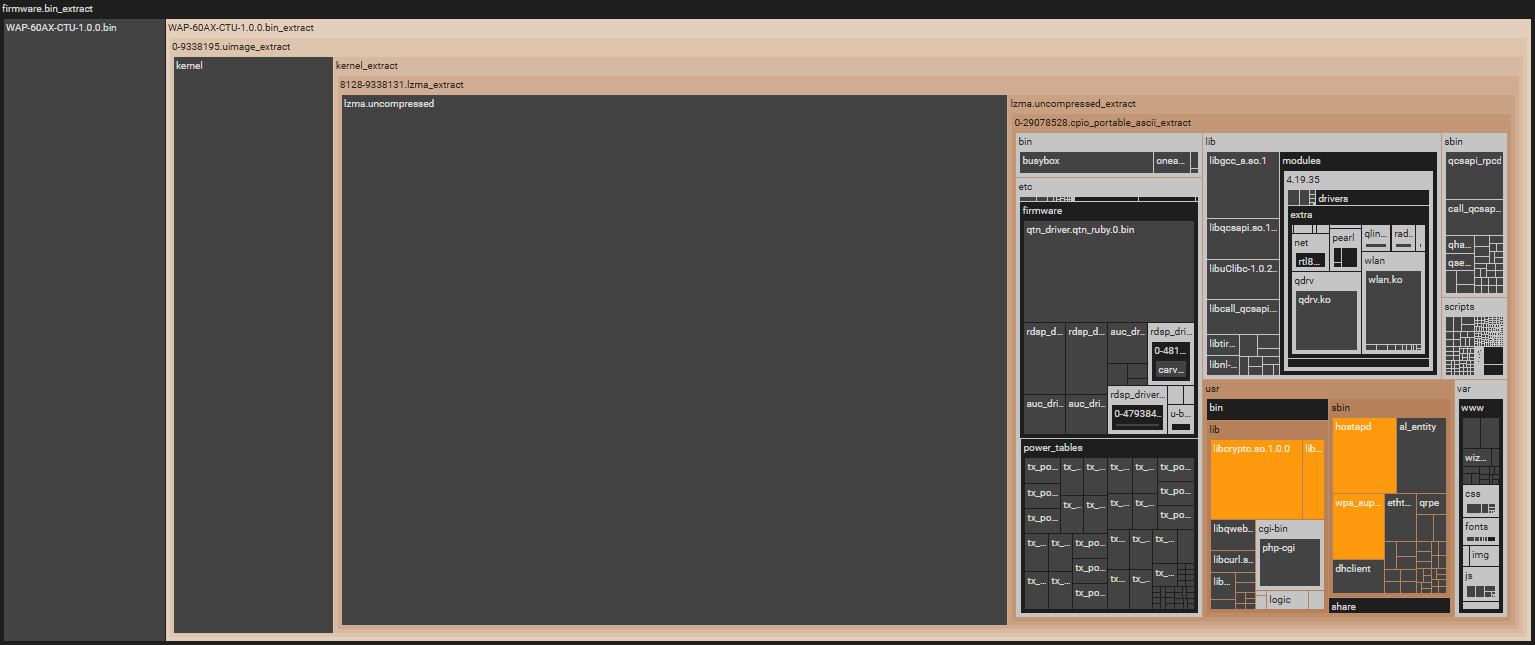
Colors and their meaning
Orange: the item/component you filtered for.
Brown: folders the selected item is located in.
Black: folders/files not related to the search.
Light gray: folders not containing the selected component/file.
ELF dependencies
On the ELF dependencies tab you can see the links between the ELF files of a firmware. (1)
-
- Hover over a node to highlight its dependencies.
- Click on a node to open the File details.
- Click on the Hidden links button to display elements that are not included in the visualization.
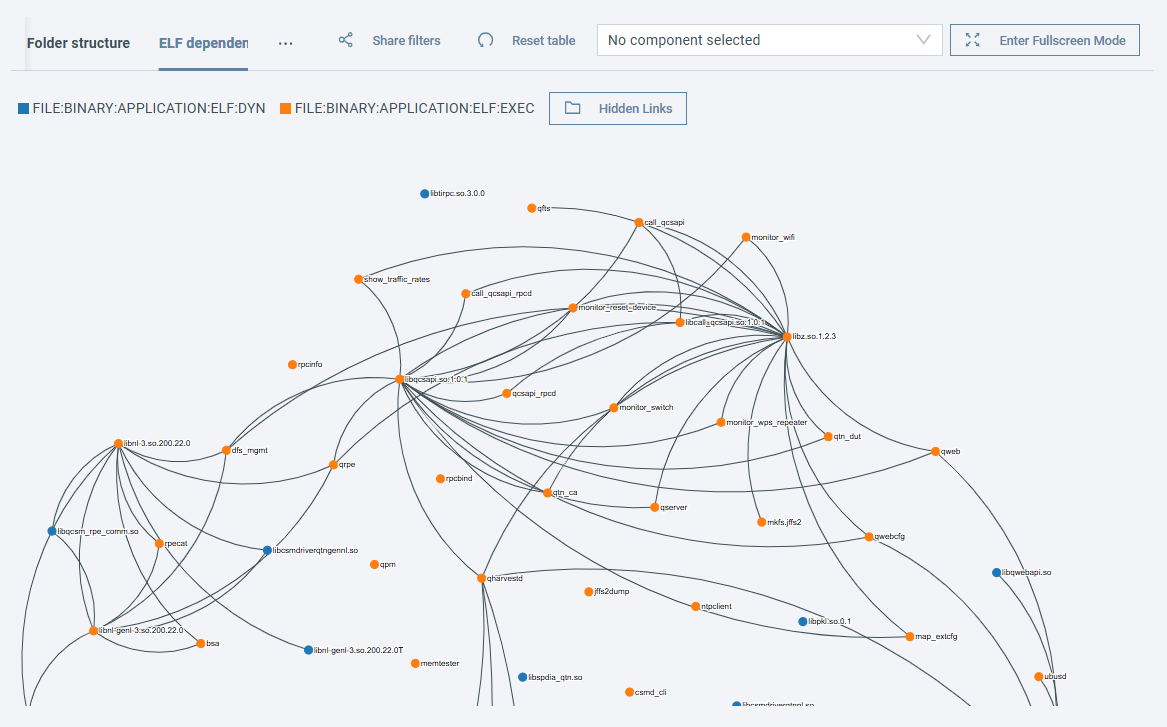
Node colors and their meaning
Blue: Dynamically linked ELF executables
Orange: Statically linked ELF executables
Use the component filter to highlight results belonging to a specific component.
Connecting lines are automatically hidden for components with more than 60 connections to improve visualization clarity. Hover over these nodes to reveal their connections.
You can check the dependencies of a specific ELF file by opening its File details and selecting the ELF Info tab. (1)
-
- Drag and drop a dependency the move the graph around.
- Click to open the graph for the selected node.
- Click 1> to see the children of the node.
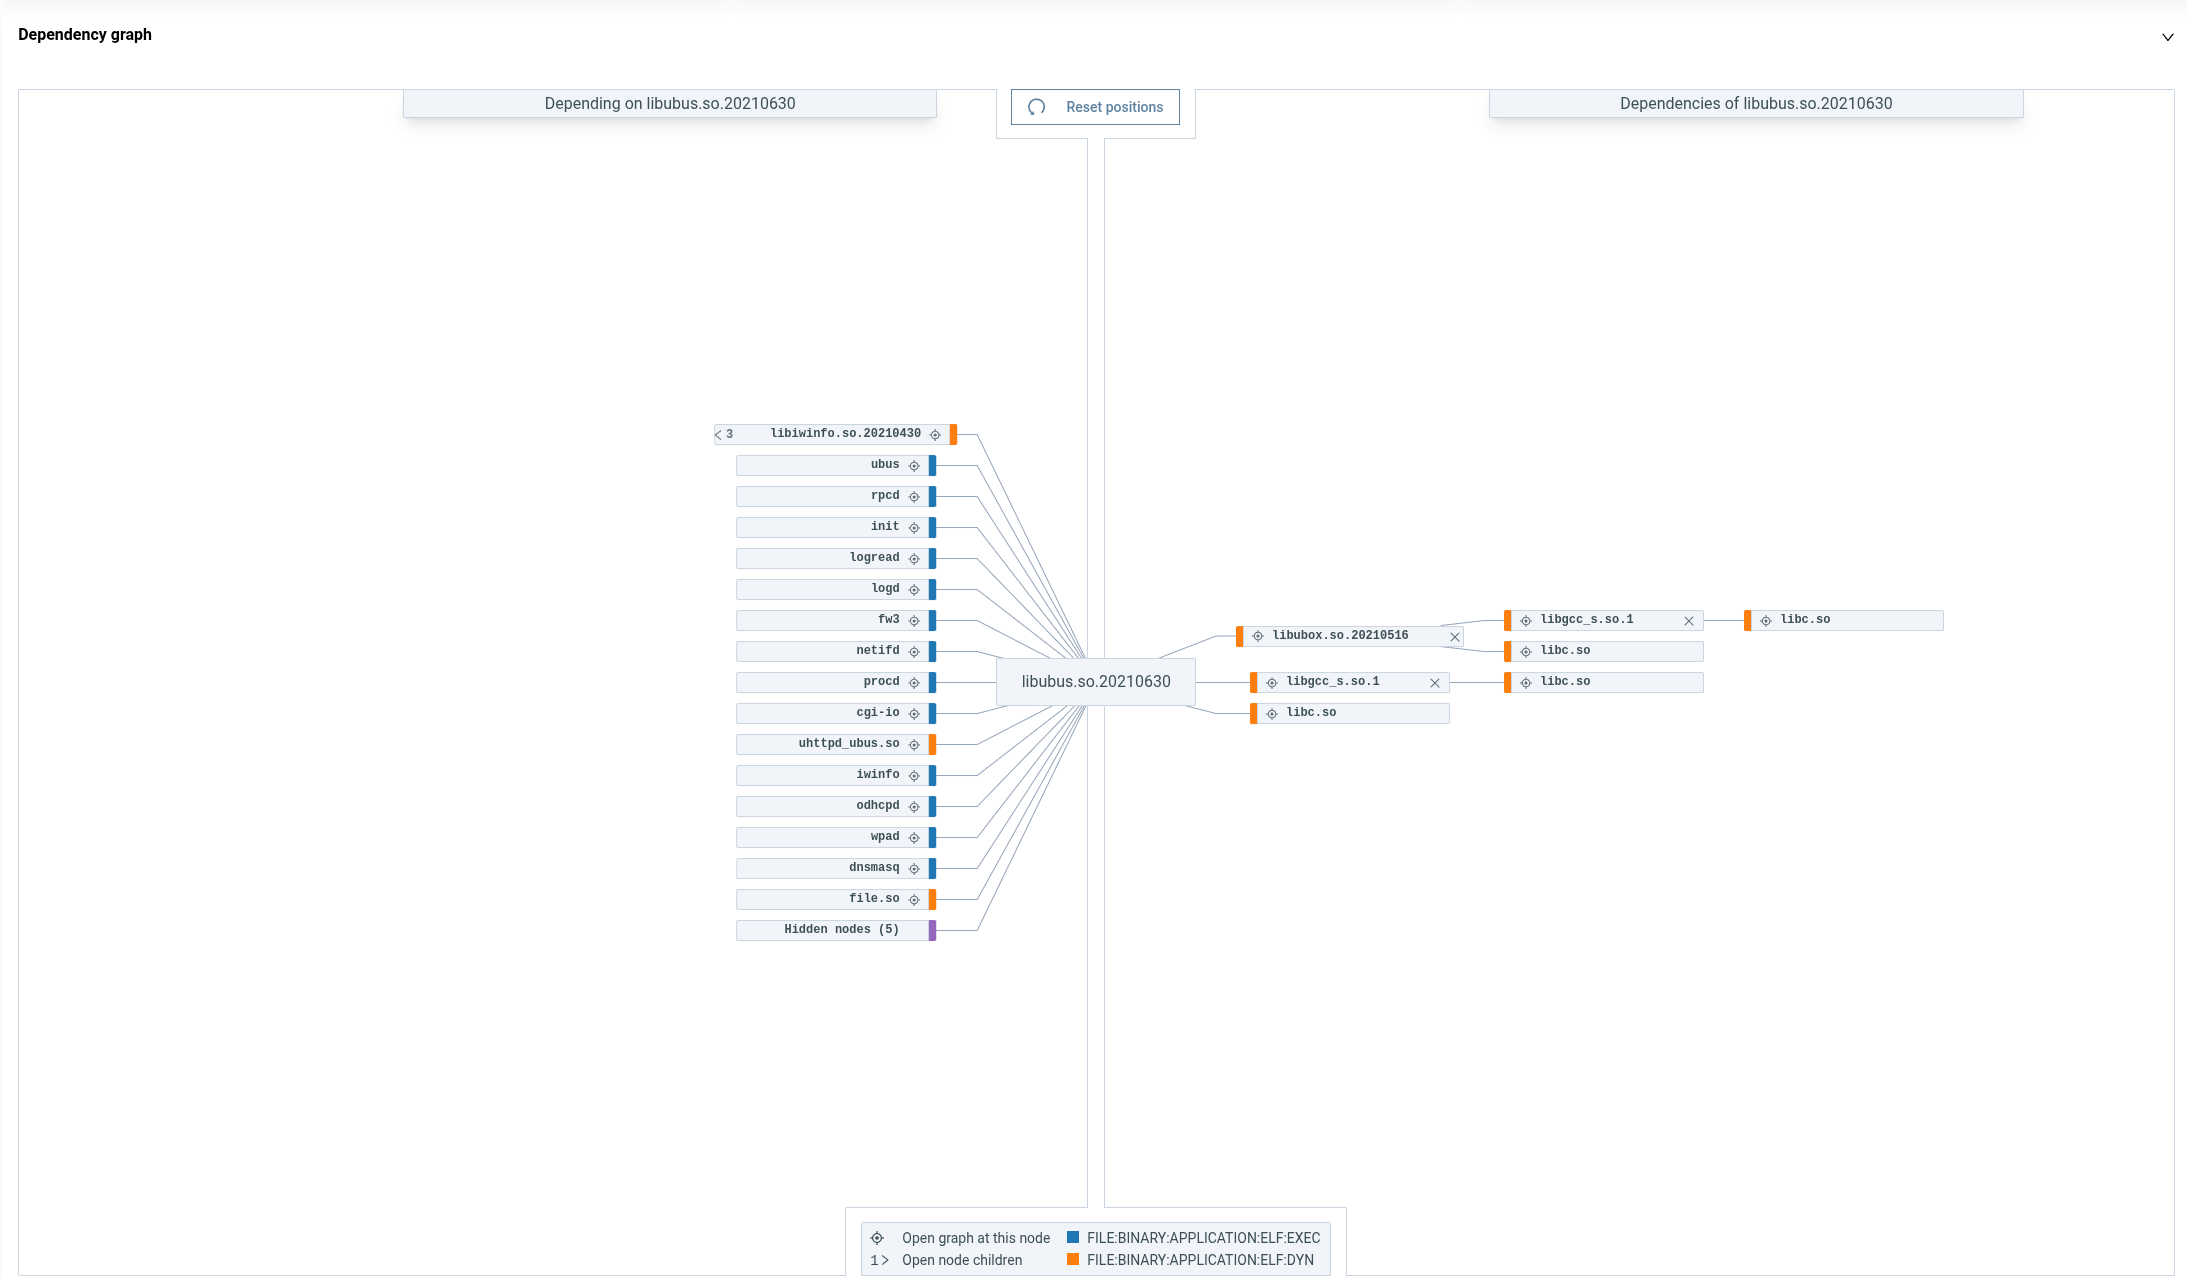
Note
If an ELF has no connections on either the 'Depending on...' or 'Dependencies of...' side, that side is hidden by default.
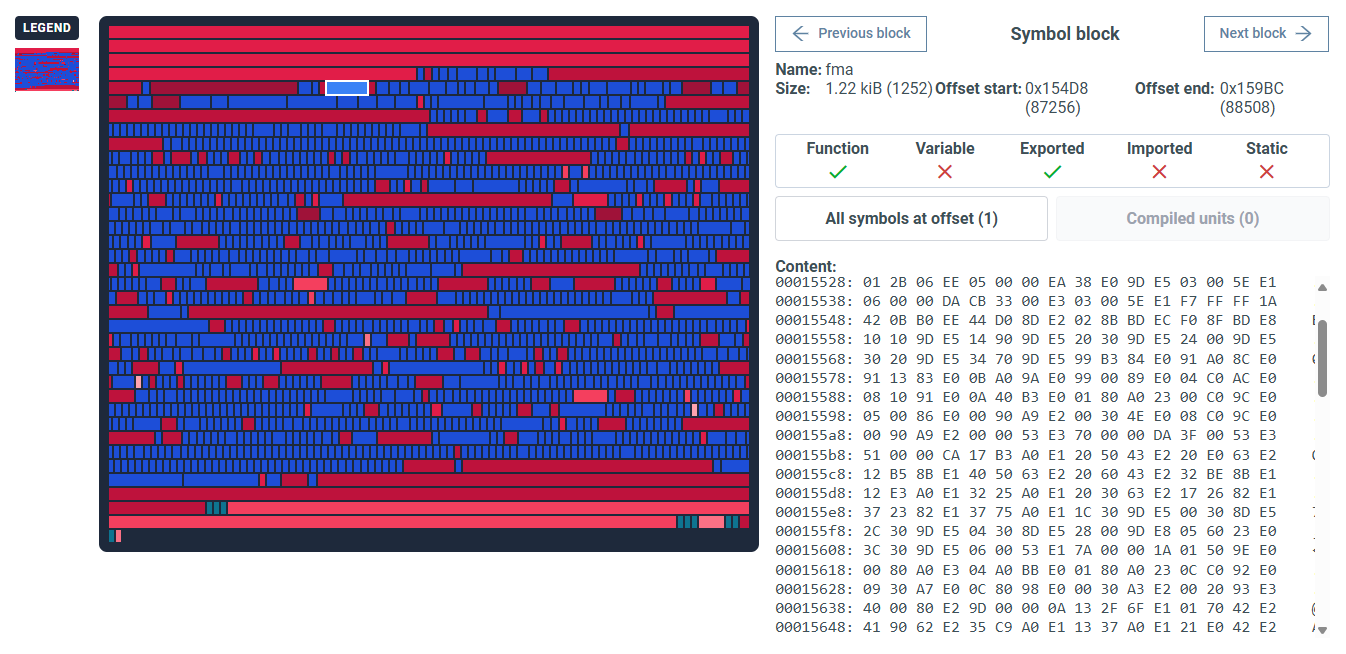
Binary code visualization
See the symbols, chunks, and unknown blocks that make up an executable file.
Click on a code block to see its content and learn more.
For unknown blocks, the redder the code block, the higher the entropy.
List of terms
- Offset: position of the symbol in a binary.
- Function: contains a named executable code fragment.
- Variable: contains data, for example text.
- Exported: other binaries can use this symbol.
- Imported: the block uses symbols of other binaries.
- Static: not dependent on an external runtime.
To find Binary code visualization:
- Open the File details (click on a file in Firmware analysis view → Files for example).
- Select the Content tab.
Extraction
Check the blobs (Binary Large Objects) extracted from your firmware. Click on a Parent file to learn more about a blob:
You can view a visualization of the firmware structure by selecting the Firmware structure tab.
Artifacts
Under the Artifacts page dropdown, you can verify the following elements of your firmware:
- Certificates: X509 certificates included in the firmware image.
- Private keys: Cryptographic keys used to ensure the security and integrity of the firmware.
- Passwords: Used to control access to various functions and features of the firmware.
- Management protocols: See protocols used for maintaining, configuring, and updating devices.
- Images:
.png,.jpgetc. files found in your firmware. - Binary Hardening: Techniques used to enhance the security of binaries to make them more resistant to attacks. Learn more under Binary Hardening.
Firmware info
This page displays selected firmware information, including upload date, file count, and monitoring status. You can also rerun the analysis here by clicking on Analyze again.
History
Here you can access:
- Analysis History: All analyses performed on the selected firmware.
- Product History: All the different versions/firmware images of the same product. Here you can track how issues/CVEs have changed over time.
- Compliance Bundle History: A list of all compliance bundles for the selected firmware. You can generate a bundle on the Compliance page, or with the ONEKEY Compliance Wizard.
- Audit Trail: List of all status changes and added comments for the selected firmware.
See History pages to learn more.
Download Analysis result
To download the latest analysis of a firmware, go to Firmware analysis view and click Download XLSX.

To download a past analysis, open the Analysis History page from Firmware analysis view and click on Download xlsx summary of analysis under the relevant entry.
Export data tables
Many tables can be exported in either .csv or .json formats.
To export a data table, click Export ... (for example 'Export components') usually found near the top-right corner of a table or under Actions, and select a file format.
You can export the data tables for specific firmware in Firmware analysis view or export global results from one of the global pages.
Global results
Firmwares tab
As you upload more and more firmware, your dashboard might fill up and not all uploads will be displayed. To see all your firmware images, click on the Firmwares tab:

Here you can perform several actions, for example compare two firmware analyses, generate a report, or delete unwanted firmware.
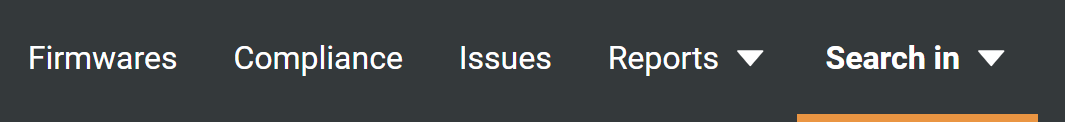
Global search
Select a page under Search in to view all found:
- files & strings,
- components,
- security issues,
- CVEs,
- or artifacts.
See Global search to learn more.
Partial or no result
If an analysis returns partial or no result, it means that the uploaded firmware contains unsupported components and not all of ONEKEY's checks could run properly. When this happens, you can ask our team for an expert review. To do so,
- Select the firmware with the faulty analysis on your dashboard.
- Click Request on the popup.
Common reasons for a failed analysis result
- Firmware encryption
- Obfuscation
- Proprietary compression methods
- Proprietary operating systems
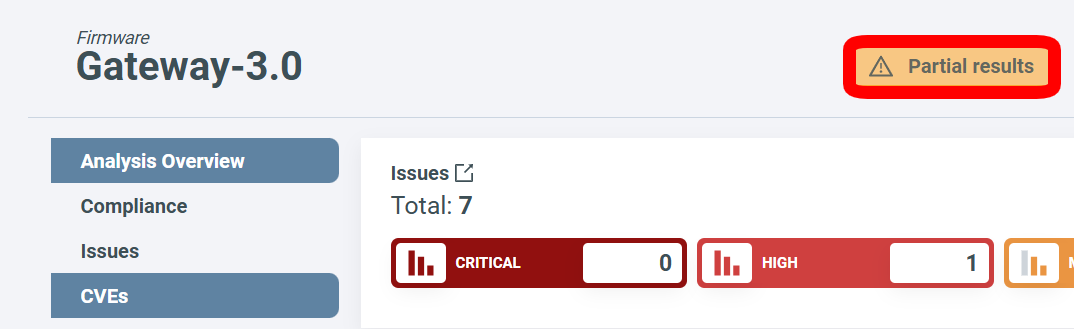
In the case of a partial result, enter Firmware analysis view and click on the Partial Result button to find out more about the problem:
In the case of no result, click on What went wrong.